
Case Study: Solar Planning Application for Fronius
Frontend work on a planning and dimensioning tool for solar installers, built during my time at PaprikArt.
Built as part of my role at PaprikArt (2020 - 2024) Hire Me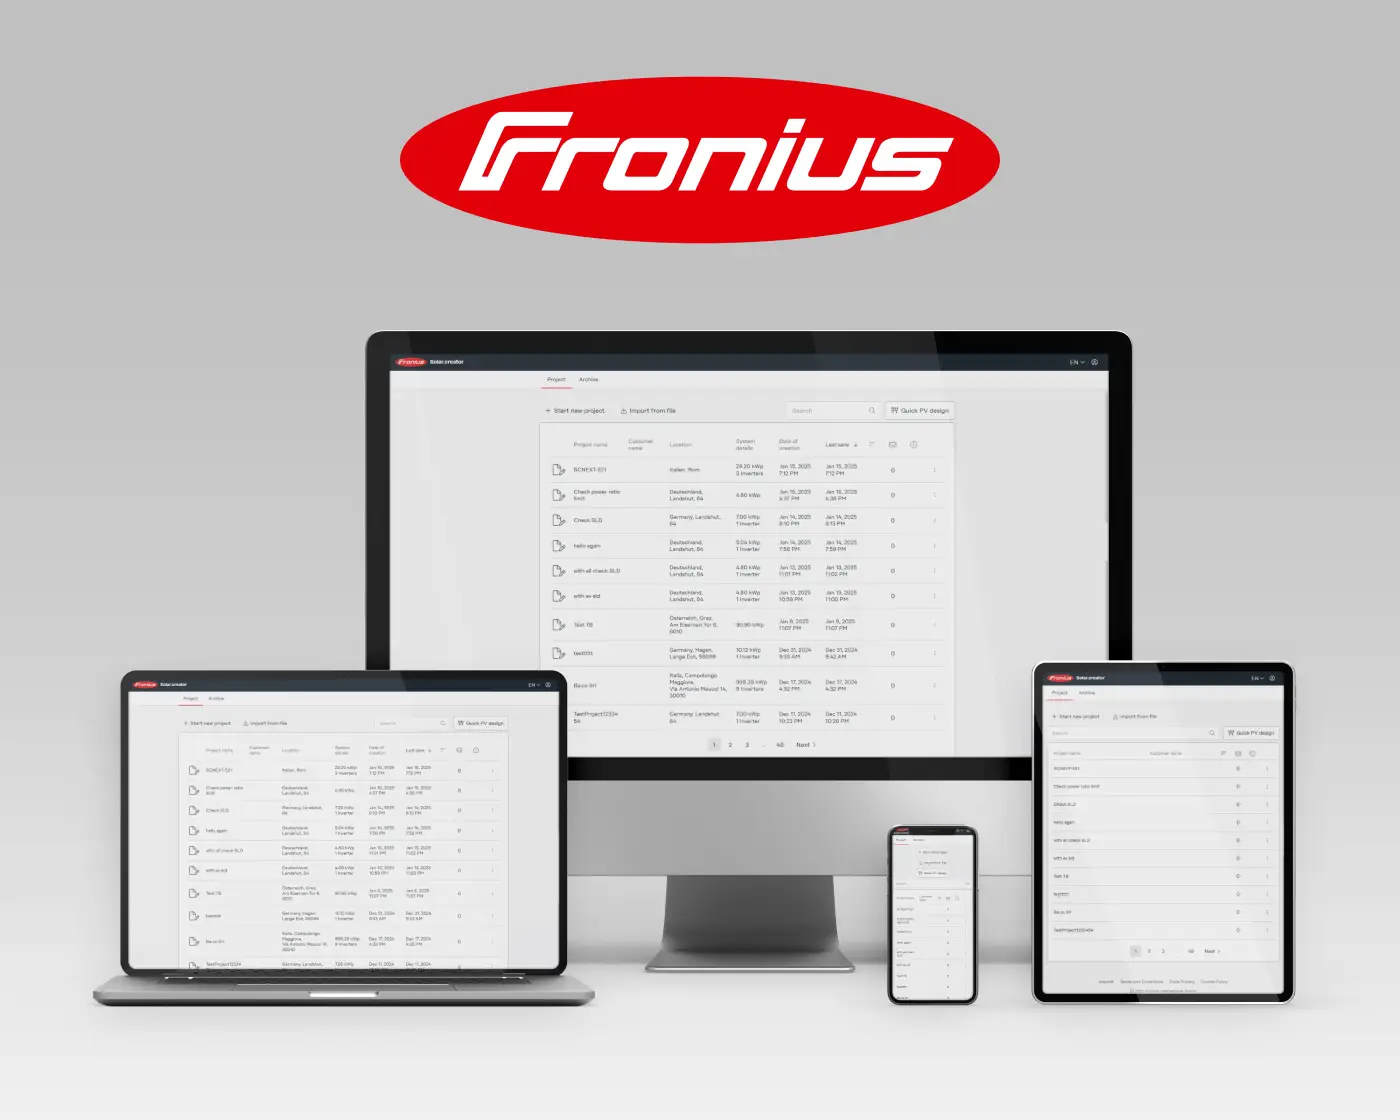
Sizing a photovoltaic system is a calculation-heavy job that installers were largely doing in spreadsheets. This application pulls the whole workflow into one guided flow: site location and irradiation, household or business consumption, generator and inverter selection, cable dimensioning, profitability, and finally a branded report the installer can hand to their customer. I worked on the frontend as part of the PaprikArt team.
What the application does
- Project creation with inputs for location, customer data, energy needs and panel specifications.
- Interactive mapping for geolocation and location-based irradiation data.
- PV system calculations: power loss, cable dimensioning and energy generation projections.
- Profitability analysis covering module degradation, electricity tariffs and cost forecasts.
- Automated, branded PDF reporting for installers to share with their clients.
My contribution
I joined the project as a frontend developer, working alongside the wider PaprikArt team. My work covered building and maintaining the step-by-step planning interface, implementing features across the project workflow, integrating the frontend with the backend calculation engine, keeping the layout responsive across desktop and tablet, and fixing defects reported from the field.
The Challenge
The interesting problems on this one were mostly about accuracy and state:
- Live recalculation: almost every input feeds a chain of downstream calculations, so the UI has to stay consistent and responsive while values change.
- Geographic data: integrating map selection so that location, irradiation and grid parameters line up correctly.
- Range of use cases: the same flow has to work for a small residential roof and for a much larger installation.
- Output quality: the generated report goes straight to an end customer, so formatting and correctness matter as much as the interface itself.
The Results
The application replaced spreadsheet-based sizing with a single guided workflow, taking an installer from a map pin to a finished, client-ready proposal without leaving the tool. For me it was several years of work on a production web application where correctness was not negotiable: a calculation-driven interface, map-based input, automated document generation, and a user base of professional installers who noticed immediately when something was off.
Built as part of my role at PaprikArt. This page describes my own contribution to the project rather than sole authorship of the product, and covers only publicly visible functionality. Product names and trademarks belong to their respective owners.