
Case Study: Inverter Monitoring Application for AEG
Frontend work on a monitoring dashboard for solar inverter fleets, built during my time at PaprikArt.
Built as part of my role at PaprikArt (2020 - 2024) Hire Me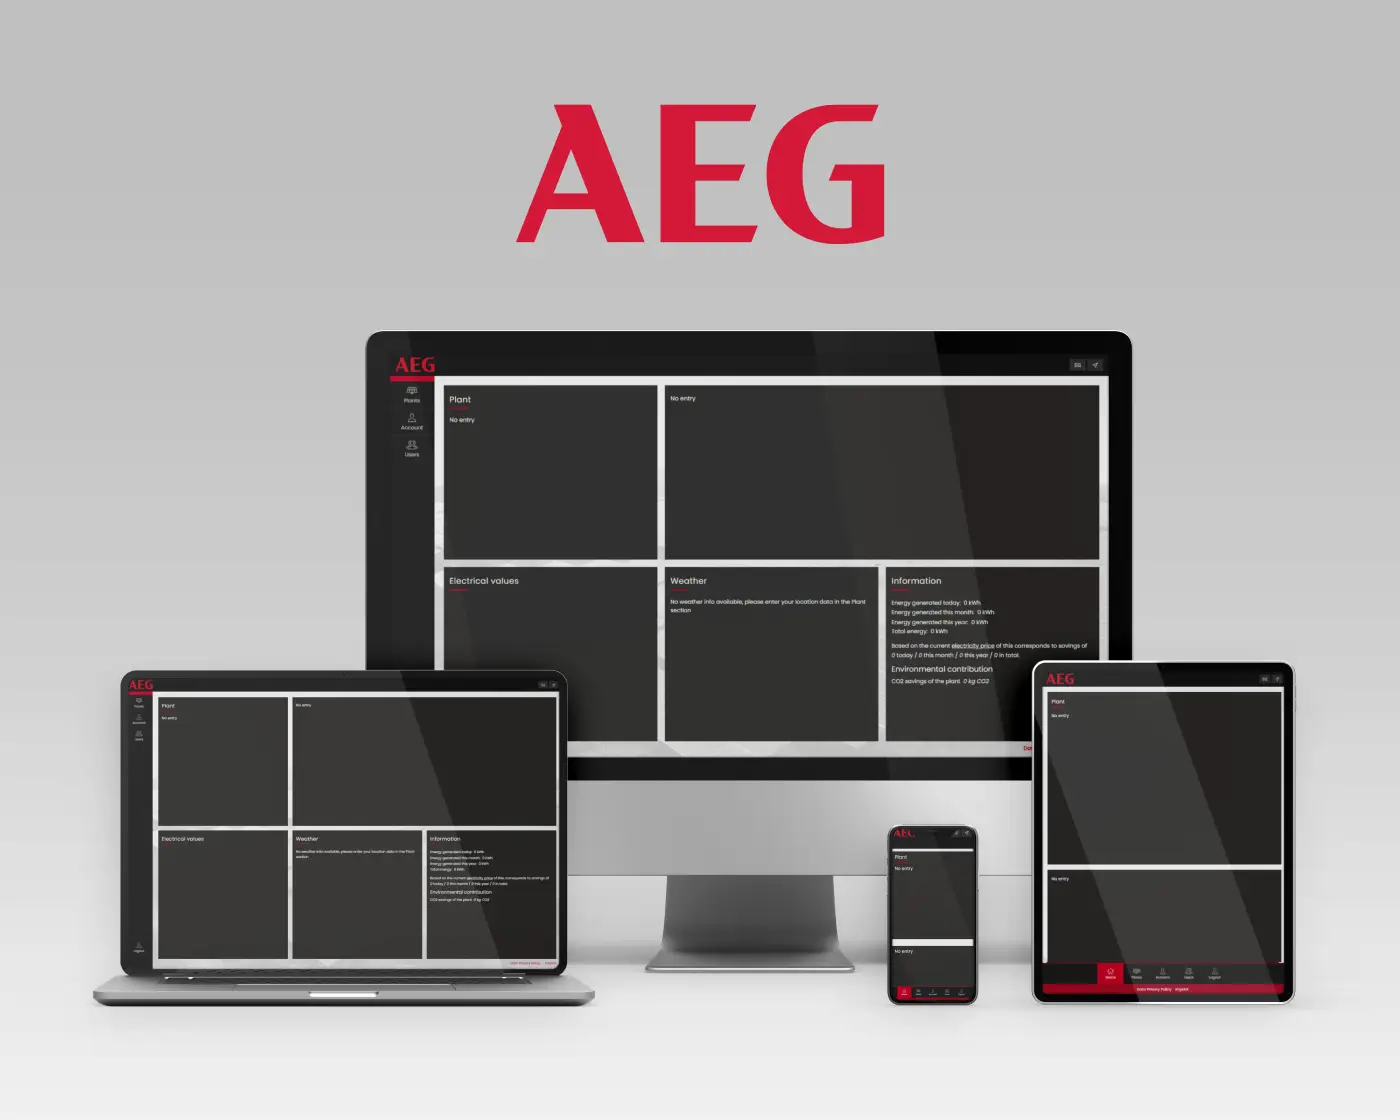
Once a solar installation is live, someone has to watch it. This application gives owners, installers and administrators a single place to follow inverter performance in near real time: electrical values, energy generated, CO2 savings, weather conditions, and where each unit physically sits on a map. I worked on the frontend as part of the PaprikArt team.
What the application does
- Near real-time monitoring of inverter status, electrical values and CO2 savings.
- Interactive map for locating inverters geographically and reviewing their performance.
- Dashboards presenting energy output, environmental impact and weather conditions.
- Notes and notifications so issues can be tracked and communicated between roles.
- Role-based views and an admin panel for installers, administrators and viewers.
- Multi-language support and a responsive layout for use on site as well as at a desk.
My contribution
I worked as a frontend developer on the application as part of the PaprikArt team: building dashboard and monitoring views, implementing features across the interface, wiring the frontend to the data APIs, handling the map integration and localization, and keeping everything usable on mobile as well as desktop.
The Challenge
A monitoring tool lives or dies on how quickly it tells you something is wrong:
- Continuously updating data: presenting frequently refreshing performance and environmental metrics without the interface feeling noisy or sluggish.
- Different users, different views: an installer, an administrator and a plant owner each need a different slice of the same data.
- Growing fleets: the interface has to hold up as the number of monitored inverters and users grows.
- International use: multi-language support across markets, including number and date formatting.
The Results
The application brought plant data, weather, geographic context and alerting together into one dashboard, so the state of an installation is visible at a glance instead of pieced together from separate sources. On my side it was substantial experience with data-dense interfaces: continuously updating dashboards, map-based navigation, role-based access, and localization for an international user base.
Built as part of my role at PaprikArt. This page describes my own contribution to the project rather than sole authorship of the product, and covers only publicly visible functionality. Product names and trademarks belong to their respective owners.